Will Cardano (ADA) Extend Its Gains as Sellers Fade?
Cardano Price Outlook: ADA targets additional upside as selling pressure eases.
FUNDAMENTAL OVERVIEW:
Cardano (ADA) remains at a critical juncture, slipping 1% on Tuesday after a 4% surge the previous day. Rising retail interest and easing selling pressure—supported by on-chain data—reflect growing optimism tied to the broader “Uptober” narrative.
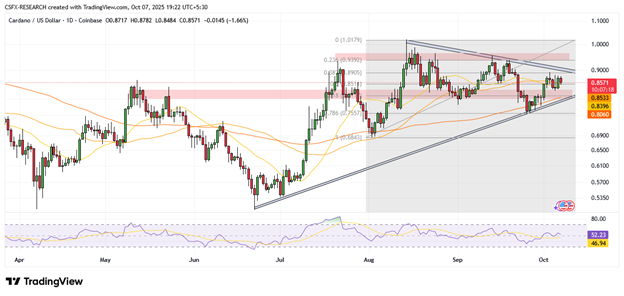
From a technical perspective, ADA is nearing the apex of a symmetrical triangle pattern on the daily chart, keeping market sentiment finely balanced. Profit-taking among investors has eased in recent weeks, further reducing downward pressure. Trading above $0.8500, ADA continues to consolidate between converging trendlines, with volatility likely to intensify as it approaches the triangle’s peak.
A sustained breakout above the upper trendline or the 50% Fibonacci retracement level at $0.9182 (drawn from the December 3 high of $1.3264 to the June 22 low of $0.5100) could signal renewed bullish momentum. In that scenario, resistance may emerge near the 61.8% and 78.6% Fibonacci retracement levels at $1.0145 and $1.1517, respectively.
Conversely, a drop below $0.8000 would confirm a downside breakout, exposing ADA to further declines toward key support levels at $0.7000 and $0.6000.
CARDANO TECHNICAL ANALYSIS DAILY CHART:

Technical Overview:
Cardano is trading within an up channel.
Cardano is moving above all the Moving Averages (SMA).
The Relative Strength Index (RSI) is in Bullish Zone, while the Stochastic oscillator suggests Neutral trend.
Immediate Resistance level: 0.872
Immediate support level: 0.816
HOW TO TRADE CARDANO
Cardano (ADA/USD) trades near key support at $0.85 within a symmetrical triangle. A rebound here could lift prices toward $0.89–$0.94, while a break below $0.83 may trigger a deeper drop toward $0.80. Traders should await a clear breakout for direction confirmation.